The Pesticide Risk Metric Calculator
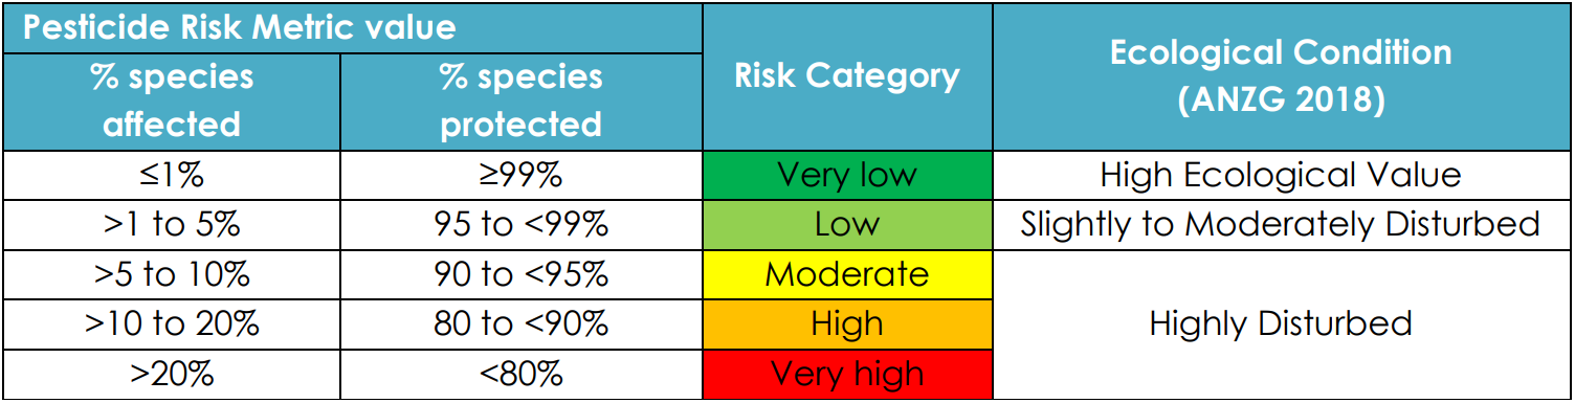
The Pesticide Risk Metric (PRM) Calculator can be used to calculate daily PRM scores and wet season PRM scores. The risk is expressed as the percentage of species potentially affected (or conversely, protected) by the combined toxicity of the 22 pesticides. In the case of the wet season PRM, the metric is intended to be calculated for a standardised wet season (182 days from the first flush event).
When using this PRM calculator, it is advised that once calculated, the user downloads the results. These results can then be uploaded again in the future should additional graphs be required. Wet season PRM results will vary very slightly every time the PRM is calculated due to the nature of the multiple imputation step, it is for this reason we advise users to calculate data once and save the output for future reupload. For guidance on how to use this app see the
For a quick run down on the PRM calculation process click
For a more in depth dive into the PRM itself, see Water Quality and Investigations Digital Products or the detailed technical report.
If you have passive sampler data please read the
If you've got calculated data downloaded from this app you can jump to...
The 22 Pesticides
9 Photosystem II (PSII) herbicides:
Ametryn
Atrazine
Diuron
Hexazinone
Metribuzin
Prometryn
Simazine
Tebuthiuron
Terbuthylazine
10 Other herbicides:
Haloxyfop (acid)
Imazapic
Metsulfuron methyl
Pendimethalin
Metolachlor
2,4-D
MCPA
Fluroxypyr
Triclopyr
Isoxaflutole metabolite (DKN)
3 Insecticides:
Chlorpyrifos
Fipronil
Imidacloprid
Fipronil
Imidacloprid
Please Read Before Uploading
All concentration data must be in µg/L
For concentrations <LOR , the < must be in the same cell as the numerical values (not in separate columns).
The PRM Calculator will treat <LOR data itself – there is no need for the user to treat these values.
If an abbreviation for a non-detect or trace value appears within your data, these must be changed to the lowest <LOR value for the associated pesticide.
For example, a trace value for chlorpyrifos should be changed to ‘<0.02’ as it is the lowest LOR.
This will vary depending on individual laboratories that run the samples.
Any character values in data will be replaced with empty cells.
Columns for all 22 reference pesticides must be present.
If you do not have data for some pesticides, column cells can be left empty but the column must still exist.
Site names are spelled consistently throughout dataset. A misspelt site name will result in it being identified as a different site.
The smaller the number of individual data points, the lower the confidence will be in the wet season average.
Upload Pesticide Data
Upload Checklist
Understanding Wet Season PRM Calculation
The calculation of the wet season PRM involves the selection of a 182-day risk window that encompasses most of the wet season rainfall, the discharge, and in tropical regions, the period of greatest risk to aquatic ecosystems. This is a prerequisite for the GBR pesticide reporting. Where data sets for an entire sampling year exist and the wet season risk is required to be calculated, the user must upload a second CSV containing the first flush date for each site in the dataset. If there are multiple years for a single site, a first flush date will be needed for each site-year combination.
To ensure accurate reporting, consider the following points when calculating the wet season Pesticide Risk Metric (PRM):
First Flush Date:
This date should reflect when there is an increase in river flow or height and an increase in detectable pesticide concentrations. It should also precede an increase in the magnitude and frequency of ‘wet’ events to allow the 182-day exposure window to capture the period of elevated pesticide concentrations. If sampling was only conducted during the wet season / high risk period (182-day time period), this step can be skipped as the calculator will use all data available to calculate the wet season PRM.
Alternative Start Date:
If a sampling regime was used that is not centred around the wet season, the user can choose a date to start the 182-day exposure window for each site. If a first flush date is not supplied, the PRM calculator will evaluate the 'wet season risk' over the period covered by the uploaded data.
Consider Sample Size:
We advise caution around interpreting the wet season PRM if the number of samples within the exposure window is low. The lower the number of sampling days within the wet season exposure window, the less confidence there is in the wet season PRM and the full range of concentrations may not be reflected over the 182-day exposure window.
Please see the check-list below for an itemised list of requirements for your data upload
Upload first flush data
First Flush Checklist
The results in the table below have been rounded to 1 decimal place as recommended in the user guide. The results in the download table will need to be rounded to 1 decimal place when reported. Additionally, it is recommended that results less than 0.1 are reported as “<0.1”. Please refer to the user guide for more information.
If plots do not appear please ensure that the "Explore Daily PRM Plots" button on the Daily Table tab has been selected.
The results in the table below have been rounded to 1 decimal place as recommended in the user guide. The results in the download table will need to be rounded to 1 decimal place when reported. Additionally, it is recommended that results less than 0.1 are reported as “<0.1”. Please refer to the user guide for more information.
The Wet Season Average will only be calculated for sampling years where a site contains at least 3 separate days of data within the sampling year of interest.
If plots do not appear please ensure that the "Explore Wet Season Plots" button on the Wet Season Table tab has been selected.
Terms of Use
The Queensland Government requires that you acknowledge the use of the Pesticide Risk Metric (PRM) Calculator for PRM generated from this app, and the following citations are recommended:
WQI PRM Calculator: Water Quality & Investigations (2024) Pesticide Risk Metric Calculator, Department of the Environment, Tourism, Science and Innovation, Brisbane, Australia
Method paper for estimating PRM: Warne MStJ, Neelamraju C, Strauss J, Smith RA, Turner RDR, Mann RM. 2020. Development of a method for estimating the toxicity of pesticide mixtures and a Pesticide Risk Baseline for the Reef 2050 Water Quality Improvement Plan. Brisbane: Department of Environment and Science, Queensland Government.
Disclaimer
No data uploaded to this application is saved or recorded. It is purely for the user.
The information presented in this application is from several sources and, as such, does not necessarily represent government or departmental policy.
While every care is taken to ensure the accuracy of this information, the Department of the Environment, Tourism, Science and Innovation makes no representations or warranties relating to accuracy, reliability, completeness, currency or suitability for any particular purpose and disclaims all responsibility and all liability (including without limitation, liability in negligence) for all expenses, losses, damages (including indirect or consequential damage) and costs that might be incurred as a result of any use or of reliance on the information and calculated data in any way and for any reason.